|
|
 |
June 17, 2007: A fitted solution to all the data taken for this experiment via simulated annealing, good to about 6%, or a mean absolute error = 0.08304 CFS, with a standard deviation of absolute error = 0.13877 CFS, is available here. It accounts for the relationship between the inflow head and the size of the headcut below the verge.
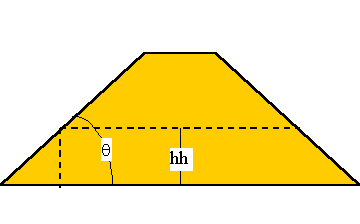
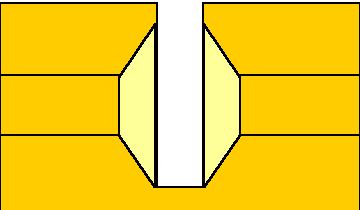
I was hired in May 2001, not having studied in basic hydraulics for nearly 30 years, to analyze the head-discharge data from physical model experiments for about 380 different prismatic geometries of simulated dam breach. Think of a symmetrical trapezoidal embankment made of plywood. The upstream slope is m = cot(q), where q (rad) is the angle of the slope up from horizontal. A trapezoidal notch with bottom width, b (in), penetrates the embankment at height hu (ft) above the upstream floor of the reservoir. The side slope of the notch is determined by the angle, f (rad), from the vertical. The bottom of the notch forms the crest of a weir of width, b, on the upstream face of the embankment. Downstream of the crest, the floor of the notch drops to a level, hh (ft), below the crest, forming a rectangular downstream channel below the notch. The height of the reservoir surface, he (ft), upstream of the Bernoulli drop was measured with respect to the elevation of the horizontal weir crest. The total flow through the embankment breach, Q (cfs), was measured by pressure drop across orifice plates in a 12 in water line.
|
|
 |
|
Top View  |
Plywood Breach Model
|
The diagrams above represent the geometric measurements and configuration of an embankment where hh = hu. The picture shows a jet flowing into a notch where hu = 1 ft and hh = 0 ft below the crest. The geometric variations for b = 16 inches (4/3 ft) were: q = 0.165, 0.245, 0.322, 0.381, 0.464, 0.785 and 1.571 rad, or m = 6:1, 4:1, 3:1, 2.5:1, 2:1, 1:1 and 0:1 of horizontal:vertical, f = 0, 0.245, 0.464, 0.785, 0,983 and 1.107, or slopes of 0:1, 1:4, 1:2.5, 1:1, 1.5:1 and 2:1, hu = 0, 0.5 and 1 ft, and hh = 0, 0.5 and 1 ft. The variations for b = 8 inches (2/3 ft) were: q = 0.322, f = 0, 0.245, 0.464, 0.785, 0,983 and 1.107, hu = 0, 0.5 and 1 ft, and hh = 0, 0.5 and 1 ft. The variations for b = 32 inches (8/3 ft) were: q = 0.322, f = 0.464, hu = 0, 0.5 and 1 ft, and hh = 0 and 1 ft. Typically only about six head-discharge measurements, Q(he), some more, some less, were taken in a range of about 0.25 cfs to 6 cfs, scaled to b = 16 in. No other physical measurements other than photographs were taken.
The experimental data are in columns of Q(cfs), he(ft, elevation of the upstream reservoir above the horizontal breach edge), hh(ft), q(rad), hu(ft), b(ft) and f(rad) for b = 8 in, b = 16 in and b = 32 in. Since the writing of this paragraph is about three years after the original postdoctoral analysis, the reader is warned that some of the less than half-dozen typographical errors that existed in the data at one time may have been forgotten and uncorrected. But since they tended to produce outliers, they should be easy to spot, if present at all.
The "Relation Derivation" theoretical approach suggested non-dimensional analysis and control volume techniques to analyze the data. But these theories are inadequate to the task. The non-dimensional analysis approach fails even to model a trapezoidal channel very well, such as that used in the National Weather Service . It also contains a few too many variables to provide unambiguous solutions. The control volume technique is predicated only upon the centerline of the breach, and does nothing to account for the inflow over sloping sides. It introduces the effect of the side slope of the breach channel as a "contraction coefficient" without any justification in the physics for doing so. It also disregards the fact that a contraction coefficient is a function of entrance or upstream velocity, which was not measured. This "Relation Derivation" approach also completely dismisses as insignificant the effect of the upstream slope of the dam on the head-discharge relation, without any justification in the physics for doing so. This "Relation Derivation" approach never checks its assumptions against the experimental data, which shows that if the upstream slope of the dam is used in forming an aerated jet, the flow dependent on the upstream slope of the dam can be several times the remainder of the flow.
It seems possible that this situation could occur when the upstream slope of the dam is significantly less erodable than the body of the dam, but still without much tensile strength. For instance, asphalt or compacted clay or unconnected paver blocks or rip rap over much more erodable soil, especially with a low tailwater, might produce a situation similar to the aerated jet of Niagara Falls, where a harder layer of stone in the river bed overlays much more erodable stone. All other things being equal, it would seem advisable to design earthen dams to fail more "gracefully", in a manner that preserves as much as possible the trapezoidal channel model of erosion through the body of the dam, and inhibit the development of any eroded headcut channel below the lowest level of the breach.
The "Relation Derivation" approaches can be replaced with data-fitting methods such as simulated annealing and TableCurve 3-D ((tm) SPSS, Inc.), and with the application of the ideal weir equation. The experimental data contains no measurements of velocity, which makes it difficult to see how control volume techniques can be used to assure conservation of momentum. Since the flow can be considered steady-state, that satisfies conservation of mass. Conservation of energy can be satisfied by integrating the ideal weir equation, developed from a classical application of the Bernoulli equation, along the breach geometric boundaries. (See Ackers, P., W.R. White, J.A. Perkins and A.J.M. Harrison, 1978, Weirs and flumes for flow measurement, J. Wiley and Sons; Henderson, F.M., 1966, Open Channel Flow, MacMillan Publ.; John, J.E.A. and W.L. Haberman, 1988, Introduction to fluid mechanics, Prentice Hall) Discharge coefficients can then be fitted to the data by means of simulated annealing and TableCurve 3-D. The non-dimensional analysis suggested in the "Relation Derivation" theoretical approach did not produce a solution in this work. However a more thorough non-dimensional analysis useful in formulating an equation of weir discharge that is linear in the PI-variables. This makes it easier to see the significant differences in flow regimes among non-aerated, fully aerated and (presumably, in the lack of sufficient defining experimental measurements) partially aerated breach jets.
The following reports contain the more thorough analyses, based in the physics of the problem and confirmed by the experimental data.
Donald L. Baker, Ph.D. Soil Physics